All countries of the world listed from A-Z:

or choose from the countries per continent below:


 |  |  |  |  |  |
 | TAIWAN general data of the country |
| General useful information |
| Note: some data are of constant value, while other are due to changes, fluctuations etc. |
| Nation and population |
| official name (short form): T'aiwan |
| country code ISO: TW [TWN] //; - FIPS: TW |
| location: Southeast Asia |
| time zone: +8 UT |
| surface (land) area: 36006 sq.km = 13902 sq.mi //; - area incl. inland waters: 36179 sq.km = 13969 sq.mi |
| geographical position in extreme co-ordinates: North: 26° N / South: 22° N / East: 125° E / West: 119° E |
| borders (land): none |
| borders (coastline): South China Sea, Pacific Ocean |
| climate: tropical monsoon |
| Government |
| independent since: 1945-10-25 ; 1949 |
| type of government: republic |
| capital: Taibei (Taipei) |
| administrative division: area county (16), municipality (7) + 2 non-Taiwan area counties |
| Population |
| population according to the last two censuses: 1990: 20393,628 ; 2000: 22226,879 |
| total population according to the estimate of midyear 2000: 22191,087 /-; 2001: 22370,461 /-; 2002: 22521,000 |
| population density: 614 per sq.km = 1589 per sq.mi |
| population growth: 0,8% //; - doubling time: 79 years |
| birth rate: 14 - 15 per 1000 |
| death rate: 6 per 1000 |
| fertility rate: 2 children per female |
| maternal mortality: per 100,000 |
| infant mortality (in the first year of life): 7 per 1000 |
| infant mortality (from 1st - 4th year of life): 5 per 1000 |
| life expectancy: 77 years (male: 74; female: 80) |
| age breakdown: 0-14 years: 28% //; - 15-59 years: 63% //; - 60+ years: 9% |
| urbanisation: 75% //; - urbanisation growth: 4% |
| percentage of urban population in the greatest city: 12% |
| Ethnic composition, language, religion |
| ethnic groups: Taiwanese (Han Chinese) 84%; mainland Chinese 14%; Aborigine 2% (Ami, Atayal, Paiwan) |
| languages: Mandarin Chinese (official); Taiwanese, Min (dilaect from Fukien), Hakka, Ami and 10 other malayan-polynesian |
| religious affiliation: Buddhist 23%; Taoist 18%; Protestant 2%; Roman Catholic 1%; Confucian 1%; non-religious 48% |
| Health |
| daily food intake: 3101 calories per capita |
| population with access to safe water: % |
| people per physician: 714 - 900 |
| people per hospital bed: 176 |
| Education, literacy |
| school enrolment: primary education 6-11 years: 100% |
| school enrolment: secondary education: 67% |
| school enrolment: tertiary education 20-24 years: 42% |
| adult literacy: 94% (male: 97%; female: 90%) [DK total: 96%] |
| Economy and infrastructure |
| Economy and trade |
| currency: New Taiwan dollar (NT$) = 100 cents |
| annual inflation rate: -0,1 / -0,2% |
| population below poverty line: % |
| Gross Domestic Product: USD 12490 per capita |
| GNI USD 11600 - 12588 per capita //; - [ppp: ] |
| GDP growth: 7% |
| income: USD 8000 - 12000 per capita |
| import: USD 102554 per capita //; - export: USD 115724per capita |
| trade: USD 7395 - 7713 per capita //; - or % of GDP |
| trade partners: US JP CN DE KW SA KR |
| human development index: //; - position of the country in the world no.: |
| female labour force: 39% |
| unemployment: 3 - 5% |
| tourism: 2 million [DK: 19?] |
| Economic activities in agriculture, fisheries, industry, mining, services, energy |
| land use: arable land: 13% [PG: 24%] //; - grass land: 11% //; - wooded area: 52% //; - arid land and desert: % |
| agriculture: labour force: 21% [PG: 11% ; FW 2003: 7%] //; - part of agriculture in GDP: 4% [FW 2001: 2%] |
| agricultural products: sugarcane, rice, citrus fruits, maize, pineapples, sweet potatoes, bananas, fish, vegetables, tea |
| livestock (million): cattle: 0,2 / ducks: 10,6 / geese: 2,8 / goats: 0,3 / pigs: 6,5-10,5 / poultry: 77-135 |
| fish catch: 1040000 - 1290000 metric tonnes |
| industry: labour force: 30% [PG: 39%; FW 2003: 35%] //; - part of industry in GDP: 43% [PG 41% ; FW 2001: 31%] |
| industrial products: textiles, chemicals, electronics, fish processing, clothing |
| mining products: silver, coal, copper, marble, dolomite, gold, natural gas, limestone |
| CO2 emission per capita: |
| services: labour force: 49% [PG: 50% ; FW 2003: 58%] //; - part of services in GDP: 54% [PG: 56% ; FW 2001: 67%] |
| energy use (kg per capita): |
| electricity use (per capita): 4946 |
| annual water use (per capita): |
| Traffic, communication |
| road network: 20042 km //; - of which paved: 89% [31583] //; - of which are motorways: 350 km [Sun-Yat-sen highway: 608 km] |
| vehicles: 112 per 1000 // international license plate: RC |
| railways: 1104, 3879, or 4600 km //; - railways passenger/km: 8975 |
| navigable inland waterways: 0 km |
| ownership telephone: 467 - 526 per 1000 // international dialling code: +886 |
| ownership radio receivers: 402 per 1000 |
| ownership tv-sets: 327 - 342 per 1000 |
| newspaper circulation: 188 per 1000 |
| persons per post office: |
| personal computers: 83 - 159 per 1000 |
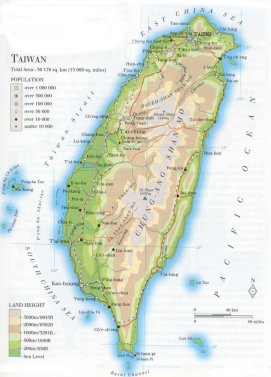
| Some physical landmarks |
| mountains: Yü Shan 3997 m, Hsüeh Shan 3931 (3884?), Kuan Shan 3715, Nanhuta Shan 3598 |
| lowest point: sea level |
| lakes (natural): none, or unknown |
| lakes (artificial reservoirs): none, or unknown |
| lakes (deepest): unknown |
| rivers: some relatively short rivers to drain the main mountain range: the Chung-ang Shan-mo |
| canals: none, or unknown |
| waterfalls: none, or unknown |
| caves: longest system: none, or unknown / deepest: |
| islands: Kinmen (Quemoy) , Lienkiang (among which Matsu), Penghu (Pescadores) |
| deserts: none |
| other natural features: |
| Additional remarks, especially on the statistical information |
| other important features: |
| apart from physical landmarks most of the above figures are changeable, in most cases they date from the 1990's |
| in some sources data of Taiwan are included in those of China (mainland) |
| primary sources used for the general information: |
| BB CA DK EV FW PW WA WB WR, and some - local national or international - statistical yearbooks |
| particulars concerning population data: |
 To the page containing the population growth statistics of the country
 To the page containing the historical population growth statistics of the provinces
 To the page containing urban historical population statistics
 Back to the homepage of this website: POPULATION STATISTICS
Internet website:Latest modification of this page on 2004-12-27 by Jan Lahmeyer
© "Populstat" website: Jan Lahmeyer