All countries of the world listed from A-Z:

or choose from the countries per continent below:


 |  |  |  |  |  |
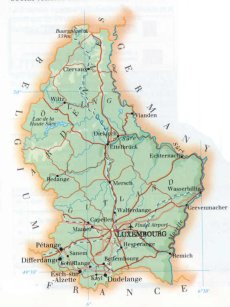 | LUXEMBOURG[Luxemburg ; Letzebuerg] : |
| General useful information |
| Note: some data are of constant value, while other are due to changes, fluctuations etc. |
| Nation and population |
| official name (short form): Lëtzebuerg ; Luxembourg ; Luxemburg |
| country code ISO: LU //; - FIPS: LU |
| location: Western Europe |
| time zone: +1 UT* [*= applying daylight saving time] |
| surface (land) area: 2586 sq.km = 999 sq.mi //; - area incl. inland waters: sq.km = sq.mi |
| geographical position in extreme co-ordinates: North: 50°10'58" N / South: 49°26'52" N / East: 06°31'53" E / West: 05°44'10" E |
| borders (land): Belgium 148 km, France 73, Germany 135 / in total 356 km |
| borders (coastline): none |
| climate: mild continental with some maritime influence |
| Government |
| independent since: 1867-05-10 |
| type of government: grand duchy |
| capital: Luxembourg (Luxemburg) |
| administrative division: district (3) into canton (12) |
| Population |
| population according to the latest census (2001): 439,764 |
| total population according to the estimate of midyear 2000: 437,389; or: 438,000 |
| population density: 169 per sq.km = 439 per sq.mi |
| population growth: 0,7% //; - doubling time: not applicable, exceeds 100 years |
| birth rate: 12 per 1000 |
| death rate: 9 - 11 per 1000 |
| fertility rate: 2 children per female |
| maternal mortality: per 100,000 |
| infant mortality (1-4 years): 9 per 1000 |
| life expectancy: 77 years (male: 74; female: 81) |
| age breakdown: 0-14 years: 17% //; - 15-59 years: 64% //; - 60+ years: 19% |
| urbanisation: 91,5% //; - urbanisation growth: % |
| percentage of urban population in the greatest city: 50% |
| Ethnic composition, language, religion |
| ethnic groups: Luxembourger 62,7%; Portuguese 13,2%; Italian 4,6%; French 4,6%; Belgians 3,4%; German 2,4%; Dutch 0,9% |
| languages: Lëtzebuergisch (Luxembourgian), French, German, English |
| religious affiliation: Roman Catholic 95%; Protestant and Jewish 5% |
| Health |
| daily food intake: calories per capita |
| population with access to safe water: % |
| people per physician: 500 |
| people per hospital bed: |
| Education, literacy |
| school enrolment: primary education 6-11 years: 100% |
| school enrolment: secondary education: % |
| school enrolment: tertiary education 20-24 years: % |
| adult literacy: 100% (male: %; female: %) |
| Economy and infrastructure |
| Economy and trade |
| currency: Euro = 100 cents (until 2002: Luxembourg franc = 100 centimes) |
| annual inflation rate: 2% |
| population below poverty line: 11% |
| Gross Domestic Product: USD 28730 per capita |
| GNI USD 42060 per capita //; - [ppp: 45470] |
| GDP growth: 4% |
| income: USD 31080 per capita |
| import: USD 9862 per capita //; - export: USD 7743 per capita |
| trade: USD 35000 per capita //; - or 96% of GDP |
| trade partners: DE BE FR NL |
| human development index: 0,924 //; - position of the country in the world no.: 12 |
| female labour force: 37% |
| unemployment: 3% |
| tourism: 0,8 million |
| Economic activities in agriculture, fisheries, industry, mining, services, energy |
| land use: arable land: 22% //; - grass land: 27% //; - wooded area: 34% //; - arid land and desert: % |
| agriculture: labour force: 4% //; - part of agriculture in GDP: 3% |
| agricultural products: some dairy products of small importance, grains, potatoes, wine grapes |
| livestock (1000s): cattle: 205 / goats: 8 / horses: 3 / pigs: 80 / poultry: 72 / sheep: 8 |
| fish catch: metric tonnes |
| industry: labour force: 19% //; - part of industry in GDP: 41% |
| industrial products: steel, chemicals, food processing, tires, engineering, metal products |
| mining products: iron ore |
| CO2 emission per capita: 18,0 |
| services: labour force: 77% //; - part of services in GDP: 56% |
| energy use (kg per capita): 8083 |
| electricity use (per capita): 12755 |
| annual water use (per capita): 159 |
| Traffic, communication |
| road network: 5179 km //; - of which paved: 99% //; - of which are motorways: 115 km |
| vehicles: 479 per 1000 |
| railways: 275 km //; - railways passenger/km: 284 |
| navigable inland waterways: 37 km |
| ownership telephone: 550 - 724 per 1000 |
| ownership radio receivers: 586 - 683 per 1000 |
| ownership tv-sets: 391 - 916 per 1000 |
| newspaper circulation: 384 per 1000 |
| persons per post office: 3860 |
| personal computers: 453 per 1000 |
| Some physical landmarks |
| mountains: Wilwerdange, Kneiff 560 m; Buurplaatz 559, Napoléonsgaard 548, Schwaarzen Hiwel 544 |
| lowest point: 130 m: at the merger of Moselle and Sûre near Wasserbillig in the commune of Mertert |
| lakes (natural): none, or unknown |
| lakes (artificial reservoirs): Lac de la Haute-Sûre (380 ha), Vianden |
| lakes (deepest): unknown |
| rivers: (with length in LU in km): Moselle 37, Our 51, Sûre 160, Alzette 60, Clerf (Woltz) 45 |
| canals: none, or unknown |
| waterfalls: none, or unknown |
| caves: longest system: none, or unknown / deepest: |
| islands: none |
| deserts: none |
| other natural features: |
| Additional remarks, especially on the statistical information |
| other important features: |
| apart from physical landmarks most of the above figures are changeable, in most cases they date from the 1990's |
| primary sources used for the general information: |
| BB CA EV PW WA WB WR, and some national statistical yearbooks |
| particulars concerning population data: |
 To the page containing the population growth statistics of the country
 To the page containing the historical population growth statistics of the provinces
 To the page containing urban historical population statistics
 Back to the homepage of this website: POPULATION STATISTICS
Internet website:Latest modification of this page on 2004-02-22 by Jan Lahmeyer
© "populstat" site: Jan Lahmeyer